Showing posts with label Baseball. Show all posts

Friday, January 13, 2023

The Evolution of the 1893 National League Batting Title

Earlier I was going through some back emails, and came across a question from the Horsehide Trivia listserv: "Who was the first player to lead the majors in batting average in consecutive seasons after the pitcher’s mound was created and set at its current distance?" The first thought that came to mind was Hugh Duffy, as I had just had his player record open in Total Baseball and noticed that he had led the National League (the only league at the time) in batting in 1893 and 1894. Yet Duffy was not the correct answer, once the other hints were taken into account - Jesse Burkett was, who led in 1895 and 1896. Confused by this discrepancy, I dove into Duffy's Baseball Reference page, and began to unearth a statistical story spanning some 130 years.

Let's start at the beginning.

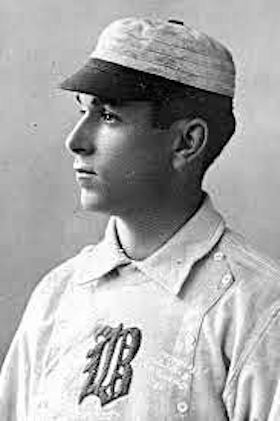
Hugh Duffy
(credit: Society for American Baseball Research)

In 1893, Billy Hamilton was the National League's leading batsman when he was diagnosed with typhoid fever in August. His season abruptly ended, having played just 82 games. His absence helped sink his Philadelphia team's chances of winning the pennant. They slid from second to finish in fourth place, 14 games behind the Boston Beaneaters, who were led by the "Heavenly Twins" of Hugh Duffy and Tommy McCarthy.

The season ended on Saturday, September 30. A week later, on October 7, The Sporting News published its tabulations of the batting averages for the league season. The publication listed the top three averages as Hamilton .407, Duffy .374, and Ed Delahanty (Hamilton's Philadelphia teammate) .370. The paper declared that "Hamilton of Philadelphia Leads the League in Batting" with the "largest percentage achieved in many years."

A week later, National League President Nick Young released the official league statistics, which were published in The Sporting Life, followed by The Sporting News the following week. This official record showed a very different leaderboard. Jake Stenzel led at .409, Hamilton was second at .395, and Sam Thompson (another Phillie) third at .377. Duffy was listed lower on the list, at "just" .359.

Spalding's Baseball Guide 1894 contained the "full official league record for 1893". It prefaced the batting record by noting, "It will be seen that the batting average record, given below, places Stenzel of the Pittsburgh club as the leading batter of the season, simply because he has the highest base hit percentage." The guide then published a near identical list as that previously seen in The Sporting News and The Sporting Life, with a major adjustment near the top: Duffy was now listed at .378, ahead of Thompson for third place. The correction of a mathematical error evidently resulted in Duffy's adjusted average - his total of 203 hits and 537 at bats were unchanged from the previous listing.

John Thorn explains what happened to the title from there: "The early record tomes, the Spalding Record Book and the Sporting News Record Book, placed Jake Stenzel (NL) in the lead for 1893 and Nap Lajoie (AL) on top in 1905. Both Stenzel and Lajoie were the leaders during the life of the Spalding volumes, 1908–1924, and in the Sporting News volume from its debut in 1921 until 1929, when Hugh Duffy replaced Stenzel, and 1930, when Elmer Flick supplanted Lajoie. The reasoning behind the Sporting News switches was that both Stenzel and Lajoie failed to meet the unwritten criterion of a representative number of games — Stenzel had played in only 60 games and Lajoie in 65, not even half of their club’s scheduled games. Otherwise the early record books’ leaders were those endorsed by the leagues."

The arrival of baseball encyclopedias in the latter half of the 20th century led to a divergence in the records. The 1969 Macmillan Baseball Encyclopedia's recompiled record lists Hamilton as the league leader at .380, followed by Thompson at .370, Delahanty at .368, and Duffy at .363. Stenzel was excluded with too few games, but Hamilton still met the "Big Mac" playing time standard it applied for the 1876-1919 period: "games played equal to at least 60 percent of games the team scheduled". (David Nemec's Great Encyclopedia of Nineteenth Century Major League Baseball has the same top four, though using a standard of 350 at bats, which Hamilton barely crossed.)

Meanwhile, as mentioned above, Total Baseball still treated Duffy as the leader. According to John Thorn, "Billy Hamilton’s average was higher than Duffy’s, and he would have met modern criteria for plate appearances. The NL, however, honored Duffy because he appeared in at least 100 games, which was expected of the leading players of that day. The title is thus accorded to him." Evidently Total Baseball was simply going off of the previous official record given by the National League, and not the recompiled record, because otherwise - by Thorn's stated standard - Thompson would have been credited with the title. (Curiously, on the 1893 leaderboard Duffy's average is listed as .362, though as .363 on his player record.)

The ESPN Baseball Encyclopedia - the spiritual successor of Total Baseball - doesn't seem to know what to do. Its top four is Thompson .370, Hamilton .380, Delahanty .368, and Duffy .363 - yet Duffy is the only player given the "black ink" treatment on his player record.

Even today, there are at least three different "official" batting titlists for 1893. Baseball Reference credits Hamilton's .380 based on the recompiled record and the modern playing time standard. However, Duffy is still also given credit. As the site explains on a page called Major League Batting Champion as Recognized at End of Year: "The Batting Titles listed are those players recognized by their leagues at the completion of the season as having the highest batting average in the league. Subsequent statistical research and rules changes may mean that we list a different batter as having the highest batting average for that season. When applicable we will give 'black ink' measurement credit to both the league batting champ and the player we believe had the highest batting average."

Meanwhile, over at Baseball Almanac, in what it describes as "the official list of batting title holders", Sam Thompson is given the title at .370.

Given all of this, what is to be learned here? In a sport that has been obsessed with statistics since its inception, reconciling of inconsistencies, reevaluation of omissions, and correction of errors find themselves just as much a part of the story. Because of this reality, the way we treat the statistical record has constantly changed throughout history. To use an analogy from constitutional law: should we take an "originalist" view that the record should reflect what the statistics were at the time they were recorded, or should we treat the record book as a "living document", constantly evolving as new data is uncovered and corrections made? 

Whatever your view, one thing is for certain: statistics will always be an integral part of baseball as long as the game is still played.

References:

Kerr, Roy. Sliding Billy Hamilton. 2009

The Sporting News, October 7, 1893

The Sporting Life, October 14, 1893

The Sporting News, October 21, 1893

Spalding's Baseball Guide and Official League Book 1894

The Baseball Encyclopedia (1st Edition)

Total Baseball (8th Edition)

The Great Encyclopedia of Nineteenth Century Major League Baseball (2nd edition)

The ESPN Baseball Encyclopedia (5th Edition)

www.baseball-almanac.com

www.baseball-reference.com

Monday, January 2, 2023

A Retroactive 6-Team MLB Postseason (1969-1993)

Major League Baseball has traditionally had the smallest postseason field of the four major North American sports leagues. However, in recent years MLB has started following in the footsteps of its competitors. 2022 marked the first season of a revised postseason format, in which six teams made the postseason for both the National and American Leagues - up from five in previous years and four from 1994-2011. These six teams are comprised of three division winners (receiving the top three seeds) and three wild card teams. The top two division winners receive a bye to the best-of-five League Division Series, while the the other four teams play in a best-of-three Wild Card Series.

Image credit: CBS Sports

I thought it would be an interesting exercise to explore what an expanded postseason format would have looked like historically in MLB. Specifically, I wanted to look at the era from 1969 to 1993, during which both the AL and NL had two divisions. In that period, the winners of the two divisions played in a League Championship Series, initially best-of-five, then best-of-seven from 1985 onward. 

Under my hypothetical six-team format, the two division winners would have advanced automatically to a best-of-five League Division Series, while four wild card teams would have played each other in a best-of-three Wild Card Series. This marks a key departure from today's format in two respects: no division winner has to play a Wild Card Series, and it is guaranteed that the team with the second-best record in a league would not have to play the team with the best record prior to the LCS, regardless of if they are a wild card team or division winner. 

Before I share what this would have looked like for each season, I want to make a few observations. First, one key advantage of this format would have been that it ensures that the team with the second-best record would have had an opportunity to reach the World Series via the postseason. In many seasons from 1969-1993, a team with the second-best record lost their own division race, while a team with an inferior record won the opposite division. Notably, twice a team won 100+ regular season games but failed to make the postseason - the Baltimore Orioles in 1980 and the San Francisco Giants in 1993.

Another observation is that while there may be concerns about the quality of teams reaching the postseason in an expanded format, the reality is that upwards of 97% of teams that hypothetically would have made the postseason would have had a .500 or better win percentage. Only 7 out of 300 teams would have made it in with a losing record. Considering that both leagues had at least 12 teams throughout it stands to reason that a format sending the top-half of the league to the postseason would generally result in teams with winning records making it in. Indeed the expansion of the American League to 14 teams in 1977 would have all but guaranteed this, with only one losing team potentially making the postseason in 17 seasons. Conversly, there still exists the possibility that teams with winning records would still miss the postseason, more so in the American League after the 1977 expansion. Those teams are also noted below.

Lastly, a note that this exercise cannot account for every change that this format would have potentially induced - particularly personnel decisions or managerial strategies for teams that would have now found themselves in playoff races they were not in otherwise. I do try to account for obvious changes that can be easily accounted for. Most notably, the absence of playoffs to decide division winners or wild cards in the new format is reflected through the use of tiebreaker criteria. This results, for instance, in the Los Angeles Dodgers winning the NL West over the Houston Astros in 1980 via a head-to-head record tiebreaker as opposed to a one-game playoff.

Without further ado, here are hypothetical postseason matchups for 1969-1993:

1969

NL Wild Card Series
#3 Chicago Cubs (93-69) vs #6 Pittsburgh Pirates (88-74)
#4 San Francisco Giants (90-72) vs #5 Cincinnati Reds (89-73)

NL Division Series
#1 New York Mets (100-62) vs #4 San Francisco/#5 Cincinnati
#2 Atlanta Braves (93-69) vs #3 Chicago/#6 Pittsburgh

AL Wild Card Series
#3 Detroit Tigers (90-72) vs #6 Washington Senators (86-76)
#4 Oakland Athletics (88-74) vs #5 Boston Red Sox (87-75)

AL Division Series
#1 Baltimore Orioles (109-53) vs #4 Oakland/#5 Boston
#2 Minnesota Twins (97-65) vs #3 Detroit/#6 Washington

Other winning teams: St. Louis Cardinals (87-75), Los Angeles Dodgers (85-77)

1970 

NL Wild Card Series
#3 Los Angeles Dodgers (87-74) vs #6 New York Mets (83-79)
#4 San Francisco Giants (86-76) vs. #5 Chicago Cubs (84-78)

NL Division Series
#1 Cincinnati Reds (102-60) vs #4 San Francisco/#5 Chicago
#2 Pittsburgh Pirates (89-73) vs #3 Los Angeles/#6 New York

AL Wild Card
#3 New York Yankees (93-69) vs #6 California Angels (86-76)
#4 Oakland Athletics (89-73) vs #5 Boston Red Sox (87-75)

AL Division Series
#1 Baltimore Orioles (108-54) vs #4 Oakland/#5 Boston
#2 Minnesota Twins (98-64) vs #3 New York/#6 California

1971

NL Wild Card Series
#3 St. Louis Cardinals (90-72) vs #6 New York Mets (83-79)
#4 Los Angeles Dodgers (89-73) vs #5 Chicago Cubs (83-79)

NL Division Series
#1 Pittsburgh Pirates (97-65) vs #4 Los Angeles/#5 Chicago
#2 San Francisco Giants (90-72) vs #3 St. Louis/#6 New York

AL Wild Card Series
#3 Detroit Tigers (91-71) vs #6 New York Yankees (82-80)
#4 Kansas City Royals (85-76) vs #5 Boston Red Sox (85-77)

AL Division Series
#1 Baltimore Orioles (101-57) vs #4 Kansas City/#5 Boston
#2 Oakland Athletics (101-60) vs #3 Detroit/#6 New York

Other winning teams: Atlanta Braves (82-80)

1972

NL Wild Card Series
#3 Houston Astros (84-69) vs #6 New York Mets (83-73)
#4 Chicago Cubs (85-70) vs #5 Los Angeles Dodgers (85-70)

NL Division Series
#1 Pittsburgh Pirates (96-59) vs #4 Chicago/#5 Los Angeles
#2 Cincinnati Reds (95-59) vs #3 Houston/#6 New York

AL Wild Card Series
#3 Chicago White Sox (87-67) vs #6 New York Yankees (79-76)
#4 Boston Red Sox (85-70) vs #5 Baltimore Orioles (80-74)

AL Division Series
#1 Oakland Athletics (93-62) vs #4 Boston/#5 Baltimore
#2 Detroit Tigers (86-70) vs #3 Chicago/#6 New York

1973

NL Wild Card Series
#3 Los Angeles Dodgers (95-66) vs #6 St. Louis Cardinals (81-81)
#4 San Francisco Giants (88-74) vs #5 Houston Astros (82-80)

NL Division Series
#1 Cincinnati Reds (99-63) vs #4 San Francisco/#5 Houston
#2 New York Mets (82-79) vs #3 Los Angeles/#6 St. Louis

AL Wild Card Series
#3 Boston Red Sox (89-73) vs #6 Minnesota Twins (81-81)
#4 Kansas City Royals (88-74) vs #5 Detroit Tigers (85-77)

AL Division Series
#1 Baltimore Orioles (97-65) vs #4 Kansas City/#5 Detroit
#2 Oakland Athletics (94-68) vs #3 Boston/#6 Minnesota

1974

NL Wild Card Series
#3 Cincinnati Reds (98-64) vs #6 Houston Astros (81-81)
#4 Atlanta Braves (88-74) vs #5 St. Louis Cardinals (86-75)

NL Division Series
#1 Los Angeles Dodgers (102-60) vs #4 Atlanta/#5 St. Louis
#2 Pittsburgh Pirates (88-74) vs #3 Cincinnati/#6 Houston

AL Wild Card Series
#3 New York Yankees (89-73) vs #6 Minnesota Twins (82-80)
#4 Texas Rangers (84-76) vs #5 Boston Red Sox (84-78)

AL Division Series
#1 Baltimore Orioles (91-71) vs #4 Texas/#5 Boston
#2 Oakland Athletics (90-72) vs #3 New York/#6 Minnesota

1975

NL Wild Card Series
#3 Los Angeles Dodgers (88-74) vs #6 St. Louis Cardinals (82-80)
#4 Philadelphia Phillies (86-76) vs #5 New York Mets (82-80)

NL Division Series
#1 Cincinnati Reds (108-54) vs #4 Philadelphia/#5 New York
#2 Pittsburgh Pirates (92-69) vs #3 Los Angeles/#6 St. Louis

AL Wild Card Series
#3 Baltimore Orioles (90-69) vs #6 Cleveland Indians (79-80)
#4 Kansas City Royals (91-71) vs #5 New York Yankees (83-77)

AL Division Series
#1 Oakland Athletics (98-64) vs #4 Kansas City/#5 New York
#2 Boston Red Sox (95-65) vs #3 Baltimore/#6 Cleveland

1976

NL Wild Card Series
#3 Los Angeles Dodgers (92-70) vs #6 Houston Astros (80-82)
#4 Pittsburgh Pirates (92-70) vs #5 New York Mets (86-76)

NL Division Series
#1 Cincinnati Reds (102-60) vs #4 Pittsburgh/#5 New York
#2 Philadelphia Phillies (101-61) vs #3 Los Angeles/#6 Houston

AL Wild Card Series
#3 Baltimore Orioles (88-74) vs #6 Boston Red Sox (83-79)
#4 Oakland Athletics (87-74) vs #5 Minnesota Twins (85-77)

AL Division Series
#1 New York Yankees (97-62) vs #4 Oakland/#5 Minnesota
#2 Kansas City Royals (90-72) vs #3 Baltimore/#6 Boston

Other winning teams: Cleveland Indians (81-78)

1977

NL Wild Card Series
#3 Pittsburgh Pirates (96-66) vs #6 Houston Astros (81-81)
#4 Cincinnati Reds (88-74) vs #5 St. Louis Cardinals (83-79)

NL Division Series
#1 Philadelphia Phillies (101-61) vs #4 Cincinnati/#5 St. Louis
#2 Los Angeles Dodgers (98-64) vs #3 Pittsburgh/#6 Houston

AL Wild Card Series
#3 Boston Red Sox (97-64) vs #6 Chicago White Sox (90-72)
#4 Baltimore Orioles (97-64) vs #5 Texas Rangers (94-68)

AL Division Series
#1 Kansas City Royals (102-60) vs #4 Baltimore/#5 Texas
#2 New York Yankees (100-62) vs #3 Boston/#6 Chicago

Other winning teams: Minnesota Twins (84-77)

1978

NL Wild Card Series
#3 Cincinnati Reds (92-69) vs #6 San Diego Padres (84-78)
#4 San Francisco Giants (89-73) vs #5 Pittsburgh Pirates (88-73)

NL Division Series
#1 Los Angeles Dodgers (95-67) vs #4 San Francisco/#5 Pittsburgh
#2 Philadelphia Phillies (90-72) vs #3 Cincinnati/#6 San Diego

AL Wild Card Series
#3 Boston Red Sox (99-63) vs #6 Texas Rangers (87-75)
#4 Milwaukee Brewers (93-69) vs #5 Baltimore Orioles (90-71)

AL Division Series
#1 New York Yankees (99-63) vs #4 Milwaukee/#5 Baltimore
#2 Kansas City Royals (92-70) vs #3 Boston/#6 Texas

Other winning teams: California Angels (87-75), Detroit Tigers (86-76)

1979

NL Wild Card Series
#3 Montreal Expos (95-65) vs #6 Philadelphia Phillies (84-78)
#4 Houston Astros (89-73) vs #5 St. Louis Cardinals (86-76)

NL Division Series
#1 Pittsburgh Pirates (98-64) vs #4 Houston/#5 St. Louis
#2 Cincinnati Reds (90-71) vs #3 Montreal/#6 Philadelphia

AL Wild Card Series
#3 Milwaukee Brewers (95-66) vs #6 Detroit Tigers (85-76)
#4 Boston Red Sox (91-69) vs #5 New York Yankees (89-71)

AL Division Series
#1 Baltimore Orioles (102-57) vs #4 Boston/#5 New York
#2 California Angels (88-74) vs #3 Milwaukee/#6 Detroit

Other winning teams: Kansas City Royals (85-77), Texas Rangers (83-79), Minnesota Twins (82-80), Cleveland Indians (81-80)

1980

NL Wild Card Series
#3 Houston Astros (92-70) vs #6 Pittsburgh Pirates (83-79)
#4 Montreal Expos (90-72) vs #5 Cincinnati Reds (89-73)

NL Division Series
#1 Los Angeles Dodgers (92-70) vs #4 Montreal/#5 Cincinnati
#2 Philadelphia Phillies (91-71) vs #3 Houston/#6 Pittsburgh

AL Wild Card Series
#3 Baltimore Orioles (100-62) vs #6 Detroit Tigers (84-78)
#4 Milwaukee Brewers (86-76) vs #5 Boston Red Sox (83-77)

AL Division Series
#1 New York Yankees (103-59) vs #4 Milwaukee/#5 Boston
#2 Kansas City Royals (97-65) vs #3 Baltimore/#6 Detroit

Other winning teams: Oakland Athletics (83-79), Atlanta Braves (81-80)

1981

NL Wild Card Series
#3 Los Angeles Dodgers (63-47) vs #6 Philadelphia Phillies (59-48)
#4 Houston Astros (61-49) vs #5 Montreal Expos (60-48)

NL Division Series
#1 Cincinnati Reds (66-42) vs #4 Houston/#5 Montreal
#2 St. Louis Cardinals (59-43) vs #3 Los Angeles/#6 Philadelphia

AL Wild Card Series
#3 Baltimore Orioles (59-46) vs #6 Boston Red Sox (59-49)
#4 New York Yankees (59-48) vs #5 Detroit Tigers (60-49)

AL Division Series
#1 Oakland Athletics (64-45) vs #4 New York/#5 Detroit
#2 Milwaukee Brewers (62-47) vs #3 Baltimore/#6 Boston

Other winning teams: Texas Rangers (57-48), Chicago White Sox (54-52), Cleveland Indians (52-51), San Francisco Giants (56-55)

1982

NL Wild Card Series
#3 Philadelphia Phillies (89-73) vs #6 Montreal Expos (86-76)
#4 Los Angeles Dodgers (88-74) vs #5 San Francisco Giants (87-75)

NL Division Series
#1 St. Louis Cardinals (92-70) vs #4 Los Angeles/#5 San Francisco
#2 Atlanta Braves (89-73) vs #4 Philadelphia/#6 Montreal

AL Wild Card Series
#3 Baltimore Orioles (94-68) vs #6 Chicago White Sox (87-75)
#4 Kansas City Royals (90-72) vs #5 Boston Red Sox (89-73)

AL Division Series
#1 Milwaukee Brewers (95-67) vs #4 Kansas City/#5 Boston
#2 California Angels (93-69) vs #3 Baltimore/#6 Chicago

Other winning teams: Pittsburgh Pirates (84-78), Detroit Tigers (83-79)

1983

NL Wild Card Series
#3 Atlanta Braves (88-74) vs #6 Montreal Expos (82-80)
#4 Houston Astros (85-77) vs #5 Pittsburgh Pirates (84-78)

NL Division Series
#1 Los Angeles Dodgers (91-71) vs #4 Houston/#5 Pittsburgh
#2 Philadelphia Phillies (90-72) vs #3 Atlanta/#6 Montreal

AL Wild Card Series
#3 Detroit Tigers (92-70) vs #6 Milwaukee Brewers (87-75)
#4 New York Yankees (91-71) vs #5 Toronto Blue Jays (89-73)

AL Division Series
#1 Chicago White Sox (99-63) vs #4 New York/#5 Toronto
#2 Baltimore Orioles (98-64) vs #3 Detroit/#6 Milwaukee

1984

NL Wild Card Series
#3 New York Mets (90-72) vs #6 Atlanta Braves (80-82)
#4 St. Louis Cardinals (84-78) vs #5 Philadelphia Phillies (81-81)

NL Division Series
#1 Chicago Cubs (96-65) vs #4 St. Louis/#5 Philadelphia
#2 San Diego Padres (92-70) vs #3 New York/#6 Atlanta

AL Wild Card Series
#3 Toronto Blue Jays (89-73) vs #6 Baltimore Orioles (85-77)
#4 New York Yankees (87-75) vs #5 Boston Red Sox (86-76)

AL Division Series
#1 Detroit Tigers (104-58) vs #4 New York/#5 Boston
#2 Kansas City Royals (84-78) vs #3 Toronto/#6 Baltimore

1985

NL Wild Card Series
#3 New York Mets (98-64) vs #6 Houston Astros (83-79)
#4 Cincinnati Reds (89-72) vs #5 Montreal Expos (84-77)

NL Division Series
#1 St. Louis Cardinals (101-61) vs #4 Cincinnati/#5 Montreal
#2 Los Angeles Dodgers (95-67) vs #3 New York/#6 Houston

AL Wild Card Series
#3 New York Yankees (97-64) vs #6 Detroit Tigers (84-77)
#4 California Angels (90-72) vs #5 Chicago White Sox (85-77)

AL Division Series
#1 Toronto Blue Jays (99-62) vs #4 California/#5 Chicago
#2 Kansas City Royals (91-71) vs #3 New York/#6 Detroit

Other winning teams: Baltimore Orioles (83-78), San Diego Padres (83-79)

1986

NL Wild Card Series
#3 Philadelphia Phillies (86-75) vs #6 St. Louis Cardinals (79-82)
#4 Cincinnati Reds (86-76) vs #5 San Francisco Giants (83-79)

NL Division Series
#1 New York Mets (108-54) vs #4 Cincinnati/#5 San Francisco
#2 Houston Astros (96-66) vs #3 Philadelphia/#6 St. Louis

AL Wild Card Series
#3 New York Yankees (90-72) vs #6 Toronto Blue Jays (86-76)
#4 Detroit Tigers (87-75) vs #5 Texas Rangers (87-75)

AL Division Series
#1 Boston Red Sox (95-66) vs #4 Detroit/#5 Texas
#2 California Angels (92-70) vs #3 New York/#6 Toronto

Other winning teams: Cleveland Indians (84-78)

1987

NL Wild Card Series
#3 New York Mets (92-70) vs #6 Philadelphia Phillies (80-82)
#4 Montreal Expos (91-71) vs #5 Cincinnati Reds (84-78)

NL Division Series
#1 St. Louis Cardinals (95-67) vs #4 Montreal/#5 Cincinnati
#2 San Francisco Giants (90-72) vs #3 New York/#6 Philadelphia

AL Wild Card Series
#3 Toronto Blue Jays (96-66) vs #6 Kansas City Royals (83-79)
#4 Milwaukee Brewers (91-71) vs #5 New York Yankees (89-73)

AL Division Series
#1 Detroit Tigers (98-64) vs #4 Milwaukee/#5 New York
#2 Minnesota Twins (85-77) vs #3 Toronto/#6 Kansas City

1988

NL Wild Card Series
#3 Cincinnati Reds (87-74) vs #6 San Francisco Giants (83-79)
#4 Pittsburgh Pirates (85-75) vs #5 San Diego Padres (83-78)

NL Division Series
#1 New York Mets (100-60) vs #4 Pittsburgh/#5 San Diego
#2 Los Angeles Dodgers (94-67) vs #3 Cincinnati/#6 San Francisco

AL Wild Card Series
#3 Minnesota Twins (91-71) vs #6 Toronto Blue Jays (87-75)
#4 Detroit Tigers (88-74) vs #5 Milwaukee Brewers (87-75)

AL Division Series
#1 Oakland Athletics (104-58) vs #4 Detroit/#5 Milwaukee
#2 Boston Red Sox (89-73) vs #3 Minnesota/#6 Toronto

Other winning teams: New York Yankees (85-76), Kansas City Royals (84-77), Houston Astros (82-80)

1989

NL Wild Card Series
#3 San Diego Padres (89-73) vs #6 St. Louis Cardinals (86-76)
#4 New York Mets (87-75) vs #5 Houston Astros (86-76)

NL Division Series
#1 Chicago Cubs (93-69) vs #4 New York/#5 Houston
#2 San Francisco Giants (92-70) vs #3 San Diego/# St. Louis

AL Wild Card Series
#3 Kansas City Royals (92-70) vs #6 Boston Red Sox (83-79)
#4 California Angels (91-71) vs #5 Baltimore Orioles (87-75)

AL Division Series
#1 Oakland Athletics (99-63) vs #4 California/#5 Baltimore
#2 Toronto Blue Jays (89-73) vs #3 Kansas City/#6 Boston

Other winning teams: Texas Rangers (83-79)

1990

NL Wild Card Series
#3 New York Mets (91-71) vs #6 San Francisco Giants (85-77)
#4 Los Angeles Dodgers (86-76) vs #5 Montreal Expos (85-77)

NL Division Series
#1 Pittsburgh Pirates (95-67) vs #4 Los Angeles/#5 Montreal
#2 Cincinnati Reds (91-71) vs #3 New York/#6 San Francisco

AL Wild Card Series
#3 Chicago White Sox (94-68) vs #6 California Angels (80-82)
#4 Toronto Blue Jays (86-76) vs #5 Texas Rangers (83-79)

AL Division Series
#1 Oakland Athletics (103-59) vs #4 Toronto/#5 Texas
#2 Boston Red Sox (88-74) vs #3 Chicago/#6 California

1991

NL Wild Card Series
#3 Los Angeles Dodgers (93-69) vs #6 Philadelphia Phillies (78-84)
#4 San Diego Padres (84-78) vs #5 St. Louis Cardinals (84-78)

NL Division Series
#1 Pittsburgh Pirates (98-64) vs #4 San Diego/#5 St. Louis
#2 Atlanta Braves (94-68) vs #3 Los Angeles/#6 Philadelphia

AL Wild Card Series
#3 Chicago White Sox (87-75) vs #6 Oakland Athletics (84-78)
#4 Texas Rangers (85-77) vs #5 Boston Red Sox (84-78)

AL Division Series
#1 Minnesota Twins (95-67) vs #4 Texas/#5 Boston
#2 Toronto Blue Jays (91-71) vs #3 Chicago/#6 Oakland

Other winning teams: Detroit Tigers (84-78), Milwaukee Brewers (83-79), Seattle Mariners (83-79), Kansas City Royals (82-80)

1992

NL Wild Card Series
#3 Cincinnati Reds (90-72) vs #6 San Diego Padres (82-80)
#4 Montreal Expos (87-75) vs #5 St. Louis Cardinals (83-79)

NL Division Series
#1 Atlanta Braves (98-64) vs #4 Montreal/#5 St. Louis
#2 Pittsburgh Pirates (96-66) vs #3 Cincinnati/#6 San Diego

AL Wild Card Series
#3 Milwaukee Brewers (92-70) vs #6 Chicago White Sox (86-76)
#4 Minnesota Twins (90-72) vs #5 Baltimore Orioles (89-73)

AL Division Series
#1 Oakland Athletics (96-66) vs #4 Minnesota/#5 Baltimore
#2 Toronto Blue Jays (96-66) vs #3 Milwaukee/#6 Chicago

1993

NL Wild Card Series
#3 San Francisco Giants (103-59) vs #6 Houston Astros (85-77)
#4 Montreal Expos (94-68) vs #5 St. Louis Cardinals (87-75)

NL Division Series
#1 Atlanta Braves (104-58) vs #4 Montreal/#5 St. Louis
#2 Philadelphia Phillies (97-65) vs #3 San Francisco/#6 Houston

AL Wild Card Series
#3 New York Yankees (88-74) vs #6 Baltimore Orioles (85-77)
#4 Texas Rangers (86-76) vs #5 Detroit Tigers (85-77)

AL Division Series
#1 Toronto Blue Jays (95-67) vs #4 Texas/#5 Detroit
#2 Chicago White Sox (94-68) vs #3 New York/#6 Baltimore

Other winning teams: Chicago Cubs (84-78), Kansas City Royals (84-78), Seattle Mariners (82-80)

Now that we've done the year-by-year overview, let's take a look at the breakdown for each team:

National League

Atlanta Braves (8 appearances, 5 division titles): 1969*, 1974, 1982*, 1983, 1984, 1991*, 1992*, 1993*
Chicago Cubs (6 appearances, 2 division titles): 1969, 1970, 1971, 1972, 1984*, 1989*
Cincinnati Reds (18 appearances, 8 division titles): 1969, 1970*, 1972*, 1973*, 1974, 1975*, 1976*, 1977, 1978, 1979*, 1980, 1981*, 1985, 1986, 1987, 1988, 1990*, 1992
Colorado Rockies: none
Florida Marlins: none
Houston Astros (13 appearances, 1 division title): 1972, 1973, 1974, 1976, 1977, 1979, 1980, 1981, 1983, 1985, 1986*, 1989, 1993
Los Angeles Dodgers (17 appearances, 7 division titles): 1970, 1971, 1972, 1973, 1974*, 1975, 1976, 1977*, 1978*, 1980*, 1981, 1982, 1983*, 1985*, 1988*, 1990, 1991
Montreal Expos (10 appearances, 0 division titles): 1979, 1980, 1981, 1982, 1983, 1985, 1987, 1990, 1992, 1993
New York Mets (14 appearances, 4 division titles): 1969*, 1970, 1971, 1972, 1973*, 1975, 1976, 1984, 1985, 1986*, 1987, 1988*, 1989, 1990
Philadelphia Phillies (14 appearances, 6 division titles): 1975, 1976*, 1977*, 1978*, 1979, 1980*, 1981, 1982, 1983*, 1984, 1986, 1987, 1991, 1993*
Pittsburgh Pirates (16 appearances, 9 division titles): 1969, 1970*, 1971*, 1972*, 1974*, 1975*, 1976, 1977, 1978, 1979*, 1980, 1983, 1988, 1990*, 1991*, 1992*
San Diego Padres (6 appearances, 1 division title): 1978, 1984*, 1988, 1989, 1991, 1992
San Francisco Giants (12 appearances, 3 division titles): 1969, 1970, 1971*, 1973, 1978, 1982, 1986, 1987*, 1988, 1989*, 1990, 1993
St. Louis Cardinals (16 appearances, 4 division titles): 1971, 1973, 1974, 1975, 1977, 1979, 1981*, 1982*, 1984, 1985*, 1986, 1987*, 1989, 1991, 1992, 1993

American League

Baltimore Orioles (19 appearances, 7 division titles): 1969*, 1970*, 1971*, 1972, 1973*, 1974*, 1975, 1976, 1977, 1978, 1979*, 1980, 1981, 1982, 1983*, 1984, 1989, 1992, 1993
Boston Red Sox (20 appearances, 4 division titles): 1969, 1970, 1971, 1972, 1973, 1974, 1975*, 1976, 1977, 1978, 1979, 1980, 1981, 1982, 1984, 1986*, 1988*, 1989, 1990*, 1991
California Angels (7 appearances, 3 division titles): 1970, 1979*, 1982*, 1985, 1986*, 1989, 1990
Chicago White Sox (9 appearances, 2 division titles): 1972, 1977, 1982, 1983*, 1985, 1990, 1991, 1992, 1993*
Cleveland Indians (1 appearance, 0 division titles): 1975
Detroit Tigers (14 appearances, 3 division titles): 1969, 1971, 1972*, 1973, 1979, 1980, 1981, 1983, 1984*, 1985, 1986, 1987*, 1988, 1993
Kansas City Royals (12 appearances, 6 division titles): 1971, 1973, 1975, 1976*, 1977*, 1978*, 1980*, 1982, 1984*, 1985*, 1987, 1989
Milwaukee Brewers (9 appearances, 2 division titles): 1978, 1979, 1980, 1981*, 1982*, 1983, 1987, 1988, 1992
Minnesota Twins (9 appearances, 4 division titles): 1969*, 1970*, 1973, 1974, 1976, 1987*, 1988, 1991*, 1992
New York Yankees (17 appearances, 4 division titles): 1970, 1971, 1972, 1974, 1975, 1976*, 1977*, 1978*, 1979, 1980*, 1981, 1983, 1984, 1985, 1986, 1987, 1993
Oakland Athletics (14 appearances, 10 division titles): 1969, 1970, 1971*, 1972*, 1973*, 1974*, 1975*, 1976, 1981*, 1988*, 1989*, 1990*, 1991, 1992*
Seattle Mariners: none
Texas Rangers/Washington Senators (8 appearances, 0 division titles): 1969, 1974, 1977, 1978, 1986, 1990, 1991, 1993
Toronto Blue Jays (11 appearances, 5 division titles): 1983, 1984, 1985*, 1986, 1987, 1988, 1989*, 1990, 1991*, 1992*, 1993*
Monday, July 16, 2018

2018 First-Half MLB WAR-Stars


The following are mock MLB All Star rosters created based on Baseball-Reference.com Wins Above Replacement (WAR). Players in bold were selected to this year's roster.

American League:
C: Wilson Ramos, TBR – 2.4
C: Austin Romine, NYY – 1.4
1B: Matt Olson, OAK – 2.5
1B: Justin Smoak, TOR – 2.2
2B: Jose Altuve, HOU – 4.4
2B: Jed Lowrie, OAK – 3.5
SS: Francisco Lindor, CLE – 5.5
SS: Andrelton Simmons, LAA – 4.6
3B: Jose Ramirez, CLE – 6.6
3B: Alex Bregman, HOU – 4.8
OF: Mike Trout, LAA – 6.8
OF: Mookie Betts, BOS – 6.3
OF: Aaron Judge, NYY – 5.0
OF: Eddie Rosario, MIN – 4.3
OF: Mitch Haniger, SEA – 3.5
OF: Andrew Benintendi, BOS – 2.9
DH: J.D. Martinez, BOS – 4.3
DH: Shin-Soo Choo, TEX – 3.3
Bench: Manny Machado, BAL – 2.9
Bench: Whit Merrifield, KCR – 2.8
SP: Chris Sale, BOS – 5.6
SP: Luis Severino, NYY – 4.9
SP: Trevor Bauer, CLE – 4.5
SP: Corey Kluber, CLE – 4.3
SP: Blake Snell, TBR – 4.1
RP: Craig Kimbrel, BOS – 2.3
RP: Blake Treinen, OAK – 2.3
RP: Lou Trivino, OAK – 2.2
Pitcher: Justin Verlander, HOU – 3.8
Pitcher: Gerrit Cole, HOU – 3.2
Pitcher: Mike Fiers, DET – 2.3
Pitcher: Reynaldo Lopez, CHW – 1.7

National League:
C: J.T. Realmuto, MIA – 3.8
C: Wilson Contreras, CHC – 2.7
1B: Freddie Freeman, ATL – 3.9
1B: Paul Goldschmidt, ARI – 3.2
2B: Javier Baez, CHC – 3.7
2B: Ozzie Albies, ATL – 3.4
SS: Trevor Story, COL – 2.9
SS: Brandon Crawford, SFG – 2.9
3B: Nolan Arenado, COL – 3.8
3B: Eugenio Suarez, CIN – 3.6
OF: Lorenzo Cain, MIL – 4.4
OF: Nick Markakis, ATL – 3.1
OF: Brian Anderson, MIA – 2.8
OF: Starling Marte, PIT – 2.7
OF: Christian Yelich, MIL – 2.5
OF: Harrison Bader, STL – 2.5
Bench: Matt Carpenter, STL – 3.5
Bench: Brandon Belt, SFG – 3.1
Bench: Scooter Gennett, CIN – 3.1
Bench: Max Muncy, LAD – 3.0
SP: Jacob deGrom, NYM – 6.0
SP: Aaron Nola, PHI – 5.9
SP: Max Scherzer, WSN – 4.9
SP: Kyle Freeland, COL – 4.6
SP: Tyler Anderson, COL – 3.7
RP: Adam Ottavino, COL – 2.4
RP: Jared Hughes, CIN – 2.3
RP: Sean Doolittle, WSN – 2.1
Pitcher: Ross Stripling, LAD – 3.2
Pitcher: Jon Lester, CHC – 2.8
Pitcher: Miles Mikolas, STL – 2.8
Pitcher: Kirby Yates, SDP – 1.5

Thursday, December 29, 2016

My Mock 2017 BBWAA Hall of Fame Ballot

Barry Bonds
Bonds is both the career (762) and single-season (73 - 2001) leader in home runs. He is also the all-time leader in walks and intentional walks. He won 7 MVPs, more than any other player. He was a 14-time All-Star, an 8-time Gold Glove winner, and a 12-time Silver Slugger recipient. During his career, he scored over 2200 runs, and came just shy of 3000 hits and 2000 RBI. He is the only player with 500+ home runs and 500+ stolen bases. Arguably the greatest player in Major League Baseball history, the only reason he has not already been inducted is his alleged PED use.

Roger Clemens
Clemens won 354 career games (9th all-time) and struck out 4672 batters (3rd all-time). He won 7 Cy Young Awards, more than any other pitcher. He was the 1986 American League MVP, and was a 2-time World Series champion with the New York Yankees (1999 and 2000). He was an 11-time All-Star, starting the game three times. Arguably one of the five greatest pitchers ever, like Bonds the sole reason he has not yet been inducted is his alleged PED use.

Ivan Rodriguez
The strongest candidate among the first-year eligibles, Pudge is one of the greatest catchers of all-time. He is the all-time leader among catchers in games played, plate appearances, at bats, runs scored, hits, and doubles. The 1999 American League MVP, he won a World Series title in 2003 with the Florida Marlins. He was a 14-time All-Star, a 13-time Gold Glover, and a 7-time Silver Slugger.

Jeff Bagwell
A lifetime Houston Astro, Bagwell was one of the greatest first basemen of all-time. He hit 449 career home runs, with over 1500 runs scored and 1500 RBI. Due to his tremendous hitting, he ranks top-25 all-time in OPS. He was the 1991 National League Rookie of the Year, and the 1994 NL MVP. He was selected to 4 All-Star games and won 3 Silver Sluggers, along with a Gold Glove in 1994.

Tim Raines
Raines was one of the greatest base stealers of all-time. He led the National League in steals in each of his first four full seasons, and ranks 5th all-time with 808 for his career. He also collected over 2600 hits and scored over 1500 runs. In 1986 he won the NL batting title, receiving a Silver Slugger award for his efforts. He was a 7-time All-Star and a 2-time World Series champion (1996 and 1998).

Curt Schilling
Schilling was one of the greatest strikeout pitchers of all-time, ranking 15th with 3116 for his career. He had three 300-strikeout seasons. He was also a tremendous postseason pitcher, going 11-2 with a 2.23 ERA in 19 career postseason starts. He won World Series titles in 2001, 2004, and 2007, and was named co-MVP of the 2001 series. He was a 6-time All-Star, starting the game twice.

Mike Mussina
Across his 18-year career, Mussina won 270 games, including 20 in his final season at age 39. He ranks in the top 20 all-time with 2813 strikeouts, and is 22nd in career strikeout-to-walk ratio. He was selected to five All-Star games, and received 7 Gold Glove awards. Although he never won the award, he did receive Cy Young votes nine times, including a runner-up finish in 1999.

Manny Ramirez
One of the game's greatest run producers, Manny slugged 555 home runs (15th all-time) and drove in 1831 RBI (18th all-time) during his career. A greatly feared hitter, he ranks 12th with 216 intentional walks. One of the greatest players in postseason history, he won the 2004 World Series MVP as he led the Red Sox to their first championship in 86 years; he won a second title in 2007. His popularity led to 12 All-Star selections and 9 Silver Sluggers. However, he was suspended for PED use toward the end of his career.

Edgar Martinez
Having spent his entire career with the Seattle Mariners, Martinez was one of the greatest designated hitters of all-time. A lifetime .312 hitter, he won American League batting titles in 1992 and 1995. He ranks 21st all-time with a .418 OBP, having led the AL in that category three times. He was selected to 7 All-Star games, and won 5 Silver Slugger awards.

Larry Walker
A lifetime .313 hitter, Walker was a 3-time batting titlist, all won while a member of the Colorado Rockies. In 1997 he led the National League with 49 home runs and 409 total bases, and was named NL MVP that year. He was selected to 5 All-Star games and won 3 Silver Sluggers for his offensive prowess. He also won 7 Gold Gloves due to his defense in right field

Monday, August 29, 2016

John Fulgham: The Best Pitcher Who Never Was

It is pretty rare nowadays for me to stumble across a quality major league player who I've never heard of, especially for players from recent decades. However, that is exactly what happened last night. In continuing to review Keith Hernandez's career, I took a look at the 1979 Cardinals, a team for whom he won the National League MVP. I noticed they had a young pitcher by the name of John Fulgham who had had a very solid season, going 10-6 with a 2.53 ERA in 146 innings. I then discovered he was a rookie that season, at age 23. Despite his numbers he did not receive a single vote for National League Rookie of the Year, an award won by Rick Sutcliffe.

Generally speaking, Fulgham is not a well-remembered major leaguer; a quick Google search did not turn up very much. Most of what has been written about him on the Internet regarded his supposed 39-pitch complete game on August 17, 1979, which if true would have been a major league record (it was not). Otherwise, these articles mostly just mention that Fulgham was a promising young starter whose career was cut short by a torn rotator cuff (an injury whose onset apparently produced a scuffle with Keith Hernandez).

In doing some more digging, however, I believe that no starting pitcher who was as good as Fulgham ever had so brief of a career. First, let's look at Wins Above Replacement. According to Baseball-Reference, Fulgham had 3.5 WAR in his rookie season, and 1.4 in 1980, for a total of about 5.0. As the table below shows, of all starting pitchers since 1901 with 5+ WAR in their first two seasons combined, only George Kaiserling, who pitched exclusively in the short-lived Federal League, also failed to pitch a third season:

Sunday, August 28, 2016

Keith Hernandez: A Hall of Fame Case

At first glance, Keith Hernandez seems like a pretty solid candidate for the Hall of Fame. He was both a good contact hitter (career .296 BA, 2182 H) and a decent on-base guy (.384 OBP, 1070 BB). He could both score runs and drive them in (1124 R, 1071 RBI). He was a batting titlist and MVP (both in 1979) and the starting first baseman for two World Series winning clubs (the ‘82 Cardinals and ‘86 Mets). He was recognized as one of the best players of his era, having been selected to five all-star games, winning two Silver Slugger awards, and receiving MVP votes in eight straight seasons. Sabermetrically speaking, he posted a 60.0 career WAR and a 128 OPS+, both of which are right at the borderline for a career first baseman. Above all, he is arguably the greatest defensive first baseman of all time, standing as that position's all-time leader in Total Zone Runs and backed up by his 11 consecutive Gold Gloves.

However, there’s seemingly one big problem: he wasn’t a power-hitter, despite playing a position largely defined by power. He hit less than 200 career home runs (162 to be exact), and his career ISO was only .140. He doesn't exactly look like your typical Hall of Fame first baseman. In fact, he looks more like a Mark Grace, or a John Olerud, or even a Will Clark, and those other non-power-hitting first basemen don’t exactly have a great track record of getting into the Hall. Accordingly, although Hernandez's name appeared on nine Hall of Fame ballots, he never received more than 10.8% of vote, nowhere near the 75% he needed for induction.

With that being said, one must consider the era in which Hernandez played. The 1970s and 1980s were not exactly the heyday of big-time slugging first basemen; in fact, it is pretty clear that there was a significant power drought at the position during this period. Taking a closer look, there were only three 40-home run seasons by a first baseman between 1969 (when Harmon Killebrew and Willie McCovey both won the MVP) and 1987 (Mark McGwire's rookie season). None of those seasons were by a career first baseman; the three players to do so were Hank Aaron and Carl Yastrzemski (traditionally outfielders) and Darrell Evans (who played much of his career at third base). 

It wasn't as if there were no other players hitting home runs then. Overall, there were 27 40-home run seasons from 1970 to 1986. That means that only about 11% of those were by a first baseman. By contrast, the rate was about 28% (30 of 108) from 1920 to 1969 and a little under 32% (59 of 128) since 1987. Looking at the overall percentage of home runs hit by first basemen, that rate was at about 18-20% from 1969-1971, peaking at 22% in 1972. From there the percentage declined precipitously, falling to below 14% in 1983-84, before rebounding to over 17% by the end of the decade.

Looking at ISO numbers instead, we see a similar pattern. The ISO of the average first baseman was about 40-50% higher than the league average from 1969-1971, also peaking in 1972 at 57%. This number then also declined, to below 15% by 1984, then rebounding to over 30% within a few years. These trends are graphed on the chart below, with the red line representing the home run percentage and the blue line representing the relative ISO.
Additionally, we can see that this period was low on individual players with high ISO seasons, especially compared with other periods. The percentage of qualified players who had an ISO greater than .200 who were first basemen between 1973 and 1986 was only 17.5%. This was far lower than it was from 1920 to 1972 (24.7%) or than it would be from 1987 to 2015 (22.6%). As the next graph shows, this period saw more qualified first basemen with ISOs less than .200 than any other; indeed, Hernandez's MVP season of 1979 was the peak year.
In other words, Hernandez played in an era with few, if any, elite power-hitting first basemen. And among the group of primarily contact hitters, he was right toward the top. In terms of batting runs from 1970 to 1994, Hernandez was behind only Rod Carew and Eddie Murray, both of whom are already Hall of Famers (it should also be noted that Carew played second base through 1975). Over the span of his career, 1974 to 1990, Hernandez was just behind Murray (63.2) and ahead of Carew (54.0) in total WAR. Of all first basemen who played entirely in the second half of the twentieth century, Hernandez ranks behind only Murray and McCovey, and ahead of Hall of Famers Tony Perez and Orlando Cepeda.

Hernandez will never be placed among the ranks of Gehrig, Foxx, Mize, Greenberg, and McCovey who came before him, or McGwire, Bagwell, Thomas, Palmeiro, and Pujols who came after, but he doesn’t have to be to be a Hall of Famer. He did exactly what an elite first baseman of his era would be expected to do offensively, and that, combined with his all-time great defense, should be enough to put him into Cooperstown.

(As a side note, it would be interesting to see what cap he would be given on his plaque in Cooperstown were he to be inducted. His best seasons clearly came with the Cardinals, but he has generally been associated with the Mets in his post-playing career, particularly in being a part of the legendary Mets broadcasting crew alongside Gary Cohen and Ron Darling.)

Sunday, October 11, 2015

The Seventh Inning

The bottom of the seventh inning was a disaster for the Mets last night. First of all, I seriously question why Noah Syndergaard started the inning in the first place. He had already thrown 101 pitches, it was the 7th inning, and Terry Collins had pretty much his entire bullpen at his disposal, having used only Clippard and Familia on Friday and with an off-day today. Granted, Syndergaard did strike out Yasmani Grandal, but Collins should have yanked him after the walk to Kike Hernandez. Instead, he let him face Utley, and that's where all the trouble started.

Despite Syndergaard's efforts to keep him on first base, Hernandez ended up stealing second base, and the now distracted and tired pitcher gave up a single to Utley. At which point Collins had no choice but to go to the bullpen. For the life of me, however, I can not understand why he went to Bartolo Colon. In a 1-run game, with runners on first and third and 1 out, what the Mets really needed was a strikeout. I don't care that Howie Kendrick was 2-for-22 against Colon; you don't put in a guy with 6.3 SO/9 who'd only made two relief appearances all year.

So no one should be surprised that Kendrick made contact. Daniel Murphy flipped the ball to Ruben Tejada at second base, at which point the game lost all sense of logic. While the run comes in to score, Utley barrels into Tejada as he is turning around to throw to first base. Utley is called out, and Tejada finds himself on the ground unable to get up.

As the delay continues for several minutes, Don Mattingly eventually comes out of the dugout to challenge the out-call at second base. (I seriously question whether the Dodgers would have challenged without this delay.) After review, Utley is called safe. (Which by the way wasn't really that clear of an overturn in my opinion.) This is inexplicable for several reasons. First, and most obviously, he never touched second base. The MLB's rationale that the umpire can award him the base because the call was wrong is total BS. Utley didn't miss second base because the umpire called him out; he never even made an attempt to touch second base because he knew he would be called out. That play at second base by Tejada, even if it wasn't technically a "neighborhood play", has pretty much always been called an out through baseball history. If Utley actually thought he had a chance to be safe he would have, you know, slid into second base. But he didn't. Plain and simple. Instead, Utley is essentially rewarded for taking out Tejada (note that Tejada never had an opportunity to attempt to tag Utley even if he didn't touch second base, while Utley went straight to the dugout even though he had ample opportunity to touch the bag.)

At the very least, Utley should have been called out, the game would have been tied, and the inning would have ended when Addison Reed got the next batter to fly out to left. But the inning continued, and the Dodgers ended up scoring three more runs (including one by Utley) to take a 5-2 lead. A completely deflated Mets team, who then learned that Ruben Tejada had broken his leg, had no chance after that.

And now, this morning, I see this rule:

"Rule 6.05 reads:
A batter is out when --
(m) A preceding runner shall, in the umpire's judgment, intentionally interfere with a fielder who is attempting to catch a thrown ball or to throw a ball in an attempt to complete any play:
Rule 6.05(m) Comment: The objective of this rule is to penalize the offensive team for deliberate, unwarranted, unsportsmanlike action by the runner in leaving the baseline for the obvious purpose of crashing the pivot man on a double play, rather than trying to reach the base. Obviously this is an umpire's judgment play."
and this one:
"Rule 7.09:
It is interference by a batter or a runner when --
(e) If, in the judgment of the umpire, a base runner willfully and deliberately interferes with a batted ball or a fielder in the act of fielding a batted ball with the obvious intent to break up a double play, the ball is dead. The umpire shall call the runner out for interference and also call out the batter-runner because of the action of his teammate. In no event may bases be run or runs scored because of such action by a runner."
Rules like these are designed to protect players from things like, I don't know, HAVING THEIR LEG BROKEN when someone leaves the baseline to break up a double play. Which is exactly what Utley did. He knew he was out at second, so he never even tried to reach second base. He "slid" (which is probably a generous term anyways) exceptionally late, when he was already parallel to the bag.

Clearly both of these rules should have applied. Take your pick. So, in reality, Utley should have been called out, Kendrick should have been called out, Hernandez should never have scored, and the game should have gone to the eighth inning with the Mets up 2-1.

And still, none of that would have changed the fact that Chase Utley broke Ruben Tejada's leg. Honestly, the worst part of this whole thing is that Utley didn't even have to do what he did. If he had just slid into second base, Kendrick almost certainly would have been safe anyway. Tejada would have had to make an essentially impossible throw to get him out at first base. And while Utley would have initially been called out, the Dodgers might still have challenged and gotten the call legitimately overturned. So the outcome would have been the same.
Except Ruben Tejada would not have a broken leg. 

Wednesday, September 30, 2015

Greinke and Kershaw: An Historic Duo

The Los Angeles Dodgers clinched the NL West last night, behind a one-hit shutout by Clayton Kershaw. This caps what has been a simply incredible season for the Dodgers pitching duo of Kershaw and Zack Greinke. These two pitchers are the first pair of qualifying starters to post a 170 ERA+ for the same team since Roger Clemens and Andy Pettitte on the 2005 Houston Astros, and just the eighth to do so since 1893 (including the 1907 Chicago Cubs, who had three pitchers accomplish this feat). They are also the first pair with 7+ WAR apiece since Roy Halladay and Cliff Lee for the 2011 Philadelphia Phillies, and the 18th since 1920. The last pair of Dodgers starters to do this was Don Drysdale and Sandy Koufax in 1964. Even more impressively, they are the only pair in the modern era to ever post WHIPs of less than 0.900 (Henry Boyle and Charlie Sweeney of the 1884 St. Louis Maroons are the only others to pull this trick). 

Monday, September 28, 2015

Baseball Notes (9/28/2015)


  • The Arizona Diamondbacks have an historically good defense this season. They currently have four players with 15+ defensive runs saved: Ender Inciarte, Nick Ahmed, Paul Goldschmidt, and A.J. Pollock. Only three other teams have ever had four players with 15+ WAR Runs Fielding: the 2012 Atlanta Braves, 1989 St. Louis Cardinals, and 1973 Baltimore Orioles. The team is ranked first in Major League Baseball in fielding runs this year.
  • Jeff Francouer is not a very good baseball player. In fact, since the beginning of 2012 he has the worst Wins Above Replacement of any player in the Major Leagues at -5.0 (the next worst is Yuniesky Betancourt at -3.2). Frenchy's OPS+ is just 75 over that span, one of the worst among players with 1000+ plate appearances. Perhaps most surprisingly, he is ranked as one of the five worst defensive right fielders over the last four seasons. Apparently his vaunted arm cannot overcome his other liabilities as an outfielder. I would suggest that he take up pitching to help prolong his career, but his one attempt at that earlier this year did not go so well: he gave up three walks, a home run, and hit a batter while allowing two earned runs in two innings of work on June 16.
  • Jake Arrieta must really want to win the Cy Young Award. Since the beginning of August he is 10-0 with a 0.44 ERA in 11 starts. His ERA+ is now up to 215, joining Zack Greinke (228) with 200+ this season. The last time two pitchers in the same league had a 200 ERA+ was 1907, when Jack Pfiester and Carl Lundgren did so - as teammates on the Chicago Cubs. Greinke himself is set to become just the sixth pitcher ever to have two seasons with a 200 ERA+, joining the elite group of Christy Mathewson, Walter Johnson, Greg Maddux, Pedro Martinez, and Roger Clemens.
  • Meanwhile, the AL Cy Young race is also down to just two contenders. Dallas Keuchel made a strong bid to solidify his position last night, allowing just one run over seven innings to pick up the win. It is remarkable just how similar Keuchel's numbers are to those of David Price, at least on the surface. Keuchel is 19-8 with 213 SO and a 2.47 ERA, while Price is 18-5 with 229 SO and a 2.45 ERA. However, Keuchel leads Price in WAR by a 7.3 to 6.0 margin. 

Wednesday, September 23, 2015

Some Random Baseball Thoughts (9/23/2015)


  • Robinson Cano is going to be a Hall of Famer. His next hit will be his 2000th, becoming just the 25th second baseman to reach that plateau. He should be able to quickly move up both the lists for hits and RBI (he's closing in on 1000) among second basemen over the next few seasons. He's already 9th all time in home runs at the position, as well as 7th in OPS (3000+ PA). Lastly, his 55.2 career WAR already puts him in the company of other Hall of Fame second basemen, and I would expect he still has some good years left in him to add to that total.

Thursday, July 30, 2015

Reggie Smith: A Hall of Fame Case

Reggie Smith is one of the most underrated players in baseball history. A seven-time all-star, Smith received just three votes when he appeared on the Hall of Fame ballot in 1988. An analysis of his career reveals that he deserved far more than that. Head below the fold to find out why.

Wednesday, July 29, 2015

2002 AL Cy Young: Pedro Martinez vs. Derek Lowe

The 2002 American League Cy Young Award proved to be one of the most controversial votes in recent memory, as Oakland A's starting pitcher Barry Zito (23-5, 2.75 ERA) beat out Pedro Martinez (20-4, 2.26 ERA). However, the player who should have won the award may not be Pedro, but rather his teammate Derek Lowe. Head below the fold to find out why.

Sunday, April 5, 2015

2015 MLB Standings Projections

American League EastAmerican League CentralAmerican League West
Toronto Blue Jays89-73--Kansas City Royals94-68--Seattle Mariners94-68--
Baltimore Orioles84-785Cleveland Indians91-713Los Angeles Angels88-746
New York Yankees75-8714Detroit Tigers88-746Houston Astros88-746
Boston Red Sox74-8815Chicago White Sox88-746Oakland Athletics75-8719
Tampa Bay Rays74-8815Minnesota Twins75-8719Texas Rangers73-8921
National League EastNational League CentralNational League West
Miami Marlins86-76--St. Louis Cardinals91-71--Los Angeles Dodgers99-63--
Washington Nationals85-771Pittsburgh Pirates83-798Colorado Rockies76-8623
New York Mets77-859Milwaukee Brewers79-8312San Francisco Giants76-8623
Philadelphia Phillies70-9216Chicago Cubs79-8312San Diego Padres72-9027
Atlanta Braves62-10024Cincinnati Reds78-8413Arizona Diamondbacks66-9633